

Last week we talked about the Dow 123 continuation pattern. As promised, today we’re going to talk about the Dow 123 reversal pattern. Before we can start to identify any pattern, we need to know what to look for. In this case, in order to trade a reversal we need to have an existing trend…
There has to be a trend in order to even think about a reversal. The underlying market environment preceding the pattern is very important. How do we know if there was an existing trend?
Were there steady red or green candles?
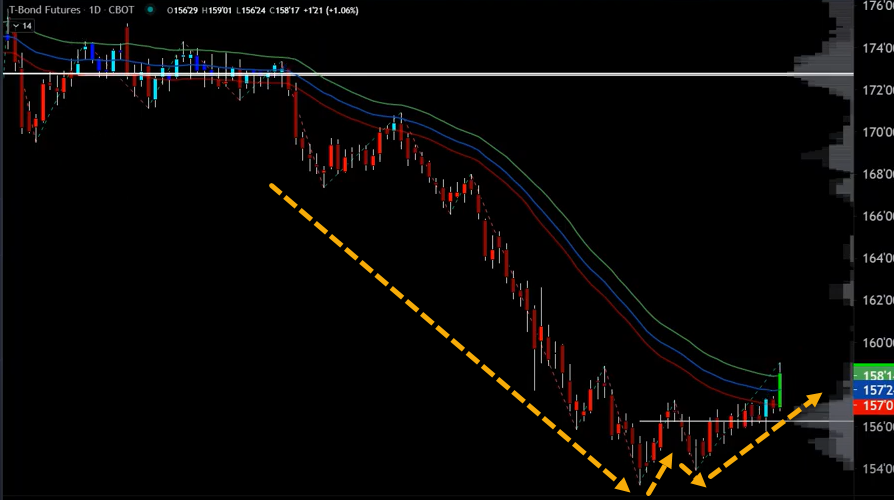
We can see in the chart below, there was a bearish trend shown by the red GRaB candles.

The next thing we need to ask ourselves is if the market is transitioning from a trend? Is the direction shifting? Let’s look at the next chart.
Here we can see the market is transitioning. That’s where we start to think about the pattern breaking.
How does the Dow 123 reversal pattern form?
Every single new low is a new opportunity to look for the pattern. Eventually, when we don’t make a new low, what we have then is a swing low or a minor low from which to start looking for a swing high or a pattern.
The chart below shows that we were no longer making any new lower lows and the market was transitioning, changing its course – maybe reversing.
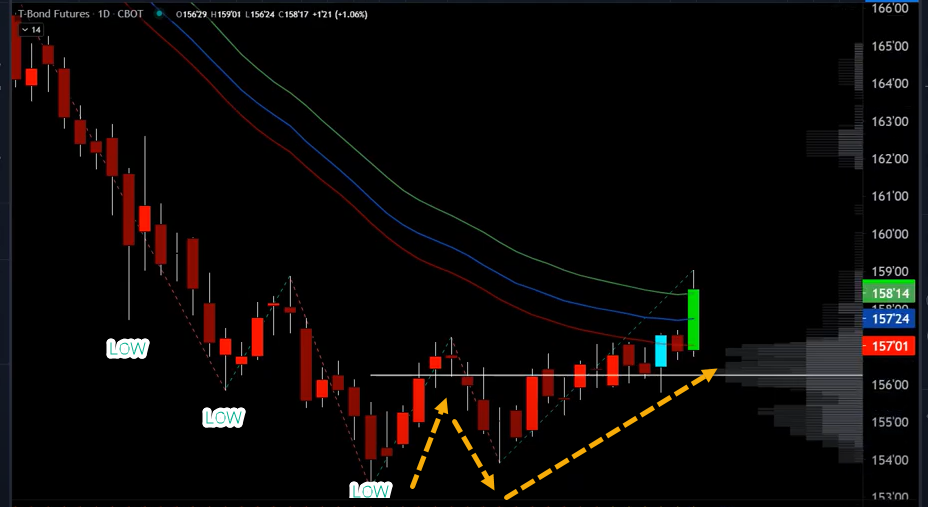
When the market swing high actually gets rejected it starts heading lower. As long as it does not make a new low – this low must remain intact. We then have our 3 points to make up the Dow 123 reversal pattern.
Let me show you what I mean…

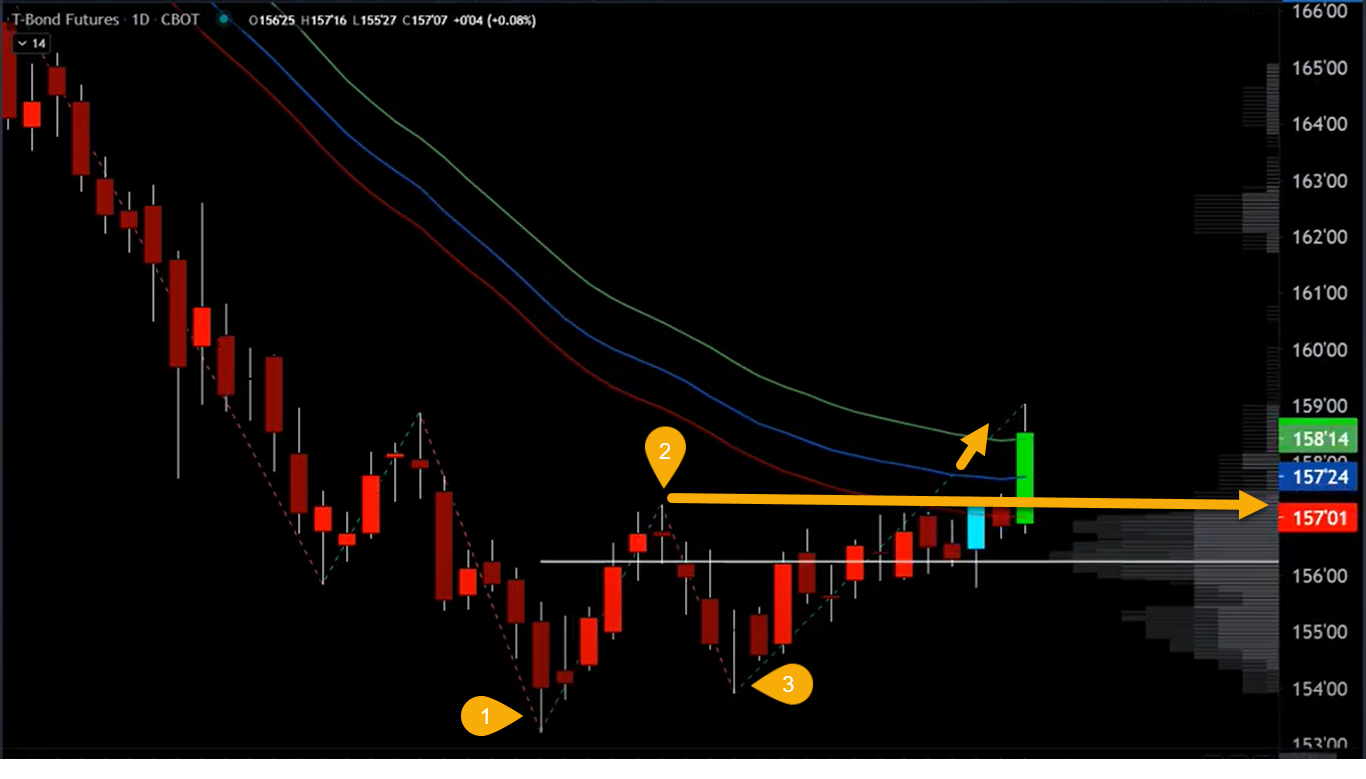
Notice that point 1 is the lowest low, point 2 is the swing high, and point 3 is the retracement of point 1 and point 2. That’s the foundation of the Dow 123 reversal pattern.
The most important part is the swing high. Where does the swing high actually break?
This market was contained below this swing high until we finally got enough momentum through the swing high. Follow the arrows in the next chart.
Not so coincidentally, here’s a bonus if you combine the “right” indicators. Look at the following chart. You’ll notice that the breakout is also through the 34 EMA Wave on the high, the close and the low.
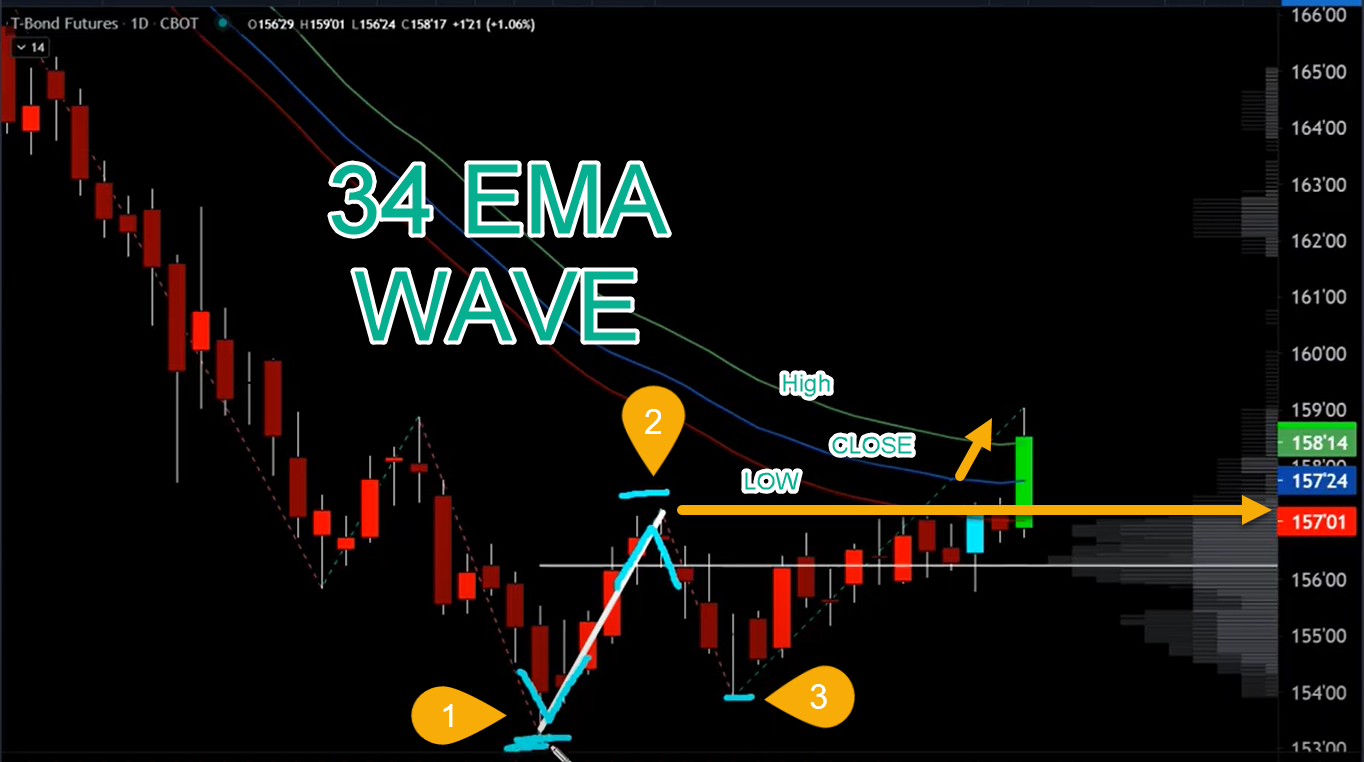
This is what I call a Dow 123 reversal pattern with a wave reversal component. Confirmation is always good and that’s part of the job of indicators, but that’s a topic for another day.
Let’s look at another example.
At first glance, the chart below looks a little different than what we just talked about but it’s still a Dow 123 Reversal Pattern.

There’s a far shorter downtrend, but it was still a trend. After the low on point 3 we didn’t get another low and the previous low (point 1 did not break). If point 3 had gone lower, we would start the count all over again.
Since it didn’t go any lower, the double bottom is fine. Remember, the previous low, point 1, has to remain intact. Point 1 is the lowest low, point 2 is the swing high, and point 3 is the retracement. As long as we don’t make a lower low, the most important level is then the swing high.
The pattern is now complete.
